Hãy bắt đầu trao đổi trực tiếp
Yêu cầu qua email
Vui lòng để lại lời nhắn tại willyb@xm.com
Hãy gửi email để được tư vấn, chúng tôi sẽ trả lời sớm nhất có thể.
EURUSD
Euro vs U.S. Dollar
US500
S&P 500 (US500)
GOLD
Gold
COFFEE
US Coffee
Apple
Apple (AAPL.OQ)

Finance Magnates 颁发

Finance Magnates 颁发

Capital Finance International Magazine (CFI.co) 2024年颁赠

COLWMA 2024年颁赠

荣获World Finance Forex Awards 2023最佳外汇客户服务奖

荣获World Finance Forex Awards 2023欧洲最佳外汇经纪商奖

荣获World Finance Forex Awards 2023澳大拉西亚最佳外汇经纪商奖

荣获World Finance Forex Awards 2023拉丁美洲最佳外汇经纪商奖

荣获World Finance Forex Awards 2023中东最佳外汇经纪商奖

CFI.co于2023年颁赠

荣获2023年City of London Wealth Management Awards

荣获2022年埃及金融博览会颁赠

荣获2022年City of London Wealth Management Awards

CFI.co于2022年颁赠

荣获Global Forex Awards 2022 — 零售外汇 颁赠
2021年迪拜外汇博览会获颁赠

Ultimate Fintech 2021年颁赠

荣获2021年City of London Wealth Management Awards

FX168于2020年12月颁赠

荣获Global Business Awards 2020

荣获2020年City of London Wealth Management Awards

Capital Finance International Magazine (CFI.co)颁赠

Capital Finance International Magazine (CFI.co)颁赠

荣获2019年City of London Wealth Management Awards

Shares Magazine 授予 UK Forex Awards 2018

Capital Finance International Magazine (CFI.co)颁赠

Capital Finance International Magazine (CFI.co)颁赠

2017年伦敦财富管理奖

2016最佳本土 客户服务

中东和北非地区(MENA)增长最快的经纪商
2015年最佳外汇科技提供商
2014年最佳外汇科技提供商

2014年最佳外汇科技提供商

荣获 The Trading Show 2024年非洲 Africa Fintech 峰会颁赠

荣获2024年中东地区 Brokersview 颁赠
荣获2024年中东地区 Brokersview 颁赠

荣获2024年阿曼 Smart Vision 峰会颁赠

荣获2024年迪拜外汇博览会颁赠

荣获2024年迪拜 Forex Traders Summit 颁赠

2024年埃及 Smart Vision 峰会颁赠

投查查于2024年颁赠

Capital Finance International Magazine (CFI.co) 2024年颁赠

CFI.co于2023年颁赠

CFI.co于2023年颁赠

交易社区平台FOLLOWME于2022年颁赠
2022年迪拜Forex Expo获颁赠
2022年迪拜Forex Expo获颁赠

荣获Global Forex Awards 2022 — 零售外汇 颁赠

CFI.co于2022年颁赠

CFI.co于2022年颁赠

World Finance Forex Awards 2022 颁发

World Finance Forex Awards 2022 颁发

World Finance Forex Awards 2022 颁发

World Finance Forex Awards 2022 颁发
交易社区平台FOLLOWME于2021年颁赠

2021年埃及Smart Vision Investment Expo博览会获颁赠

CFI.co于2021年颁赠

CFI.co于2021年颁赠

荣获Global Forex Awards 2021 — 零售外汇 颁赠

荣获Global Forex Awards 2021 — 零售外汇 颁赠

World Finance 2021颁发

World Finance 2021颁发
FOLLOWME于2021年颁赠

Global Forex Awards 2021 — B2B 颁赠

Global Forex Awards颁赠

Global Forex Awards颁赠

CFI.co于2020年颁赠

CFI.co于2020年颁赠

荣获Global Business Awards 2020

World Finance Magazine 颁赠
World
Finance Forex Awards 2020

World Finance Magazine 颁赠
World
Finance Forex Awards 2020
FOLLOWME交易社区授予

Global Forex Awards颁赠

Global Forex Awards颁赠

FinTech Age Awards颁发

World Finance Magazine 颁赠
World
Finance Forex Awards 2019

World Finance Magazine 颁赠
World
Finance Forex Awards 2019

荣获 World Finance Forex Awards 2018 颁赠

荣获2018年埃及金融博览会颁赠

荣获 Shares Magazine 的 UK Forex Awards 2017 颁赠

荣获 World Finance Forex Awards 2017

2016年最佳黄金经纪商
2016年最佳外汇经纪商

2015年最佳本地客户服务

Global Brands Magazine 颁赠

Online Money Awards 2022 颁发

荣获2022年埃及金融博览会颁赠

2015最佳外汇交易平台

2015最佳金融交易平台

2013最佳创新外汇平台奖

2020年 Cyprus HR Awards 颁赠

金融行业的佼佼者

认证最优金牌级别

2014年首届亚军
Finance Magnates 颁发
Finance Magnates 颁发
Capital Finance International Magazine (CFI.co) 2024年颁赠
COLWMA 2024年颁赠
荣获World Finance Forex Awards 2023最佳外汇客户服务奖
荣获World Finance Forex Awards 2023欧洲最佳外汇经纪商奖
荣获World Finance Forex Awards 2023澳大拉西亚最佳外汇经纪商奖
荣获World Finance Forex Awards 2023拉丁美洲最佳外汇经纪商奖
荣获World Finance Forex Awards 2023中东最佳外汇经纪商奖
CFI.co于2023年颁赠
荣获2023年City of London Wealth Management Awards
荣获2022年埃及金融博览会颁赠
荣获2022年City of London Wealth Management Awards
CFI.co于2022年颁赠
荣获Global Forex Awards 2022 — 零售外汇 颁赠
2021年迪拜外汇博览会获颁赠
Ultimate Fintech 2021年颁赠
荣获2021年City of London Wealth Management Awards
FX168于2020年12月颁赠
荣获Global Business Awards 2020
荣获2020年City of London Wealth Management Awards
Capital Finance International Magazine (CFI.co)颁赠
Capital Finance International Magazine (CFI.co)颁赠
荣获2019年City of London Wealth Management Awards
Shares Magazine 授予 UK Forex Awards 2018
Capital Finance International Magazine (CFI.co)颁赠
Capital Finance International Magazine (CFI.co)颁赠
2017年伦敦财富管理奖
2016最佳本土 客户服务
中东和北非地区(MENA)增长最快的经纪商
2015年最佳外汇科技提供商
2014年最佳外汇科技提供商
2014年最佳外汇科技提供商
荣获 The Trading Show 2024年非洲 Africa Fintech 峰会颁赠
荣获2024年中东地区 Brokersview 颁赠
荣获2024年中东地区 Brokersview 颁赠
荣获2024年阿曼 Smart Vision 峰会颁赠
荣获2024年迪拜外汇博览会颁赠
荣获2024年迪拜 Forex Traders Summit 颁赠
2024年埃及 Smart Vision 峰会颁赠
投查查于2024年颁赠
Capital Finance International Magazine (CFI.co) 2024年颁赠
CFI.co于2023年颁赠
CFI.co于2023年颁赠
交易社区平台FOLLOWME于2022年颁赠
2022年迪拜Forex Expo获颁赠
2022年迪拜Forex Expo获颁赠
荣获Global Forex Awards 2022 — 零售外汇 颁赠
CFI.co于2022年颁赠
CFI.co于2022年颁赠
World Finance Forex Awards 2022 颁发
World Finance Forex Awards 2022 颁发
World Finance Forex Awards 2022 颁发
World Finance Forex Awards 2022 颁发
交易社区平台FOLLOWME于2021年颁赠
2021年埃及Smart Vision Investment Expo博览会获颁赠
CFI.co于2021年颁赠
CFI.co于2021年颁赠
荣获Global Forex Awards 2021 — 零售外汇 颁赠
荣获Global Forex Awards 2021 — 零售外汇 颁赠
World Finance 2021颁发
World Finance 2021颁发
FOLLOWME于2021年颁赠
Global Forex Awards 2021 — B2B 颁赠
Global Forex Awards颁赠
Global Forex Awards颁赠
CFI.co于2020年颁赠
CFI.co于2020年颁赠
荣获Global Business Awards 2020
World Finance Magazine 颁赠
World
Finance Forex Awards 2020
World Finance Magazine 颁赠
World
Finance Forex Awards 2020
FOLLOWME交易社区授予
Global Forex Awards颁赠
Global Forex Awards颁赠
FinTech Age Awards颁发
World Finance Magazine 颁赠
World
Finance Forex Awards 2019
World Finance Magazine 颁赠
World
Finance Forex Awards 2019
荣获 World Finance Forex Awards 2018 颁赠
荣获2018年埃及金融博览会颁赠
荣获 Shares Magazine 的 UK Forex Awards 2017 颁赠
荣获 World Finance Forex Awards 2017
2016年最佳黄金经纪商
2016年最佳外汇经纪商
2015年最佳本地客户服务
Global Brands Magazine 颁赠
Online Money Awards 2022 颁发
荣获2022年埃及金融博览会颁赠
2015最佳外汇交易平台
2015最佳金融交易平台
2013最佳创新外汇平台奖
2020年 Cyprus HR Awards 颁赠
金融行业的佼佼者
认证最优金牌级别
2014年首届亚军

连续多年获评最佳经纪商
Điểm nổi bật:
Chào mọi người, hôm nay XM Forex sẽ mang đến cho các bạn "Trading Recommendations and Analysis for EUR/USD on April 27. A Boring Day, but There Are Profits". Hy vọng bài viết này hữu ích! Nội dung gốc như sau:
> Phân Tích Giao Dịch và Mẹo Giao Dịch Đồng Euro Việc kiểm định vùng giá 1,1690 diễn ra đúng lúc chỉ báo MACD vừa...
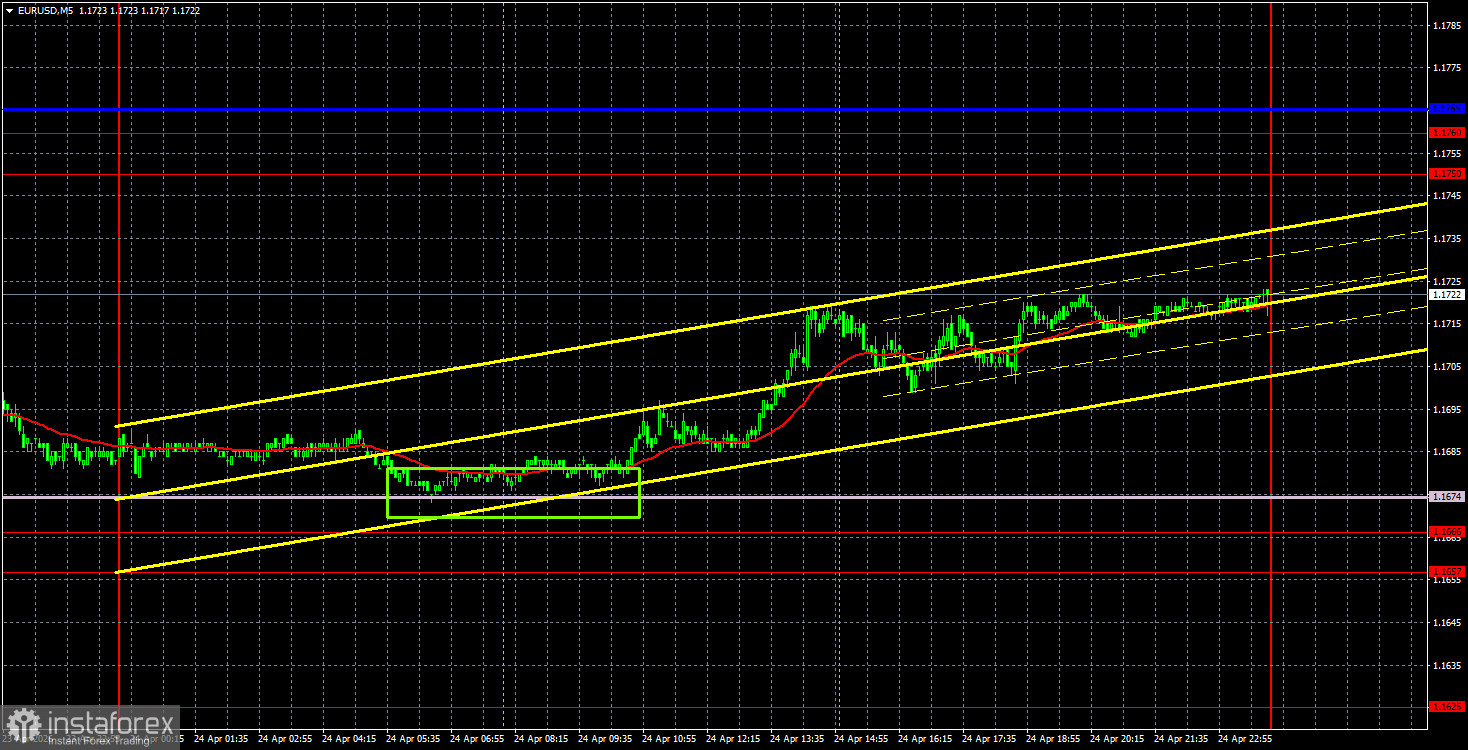
On Friday,xm外汇平台官网 the EUR/USD currency pair would have continued its downward movement if it hadn't encountered a strong support line from the Ichimoku indicator—Senkou Span B. Essentially, the entire day turned out to be technical. There were no significant macroeconomic reports in the Eurozone, and the University of Michigan consumer sentiment index in the US was published only in the evening. The final value for April is 49.8 points, which is above forecasts but below the previous value. Thus, it is hard to definitively say whether this report was positive. However, it doesn't matter much since the market continues to ignore almost the entire macroeconomic backdrop. The illustration above shows that there was no reaction to this report. There was also a report that Iranian Foreign Minister Abbas Araqchi was heading to Pakistan, but this event did not provide significant support for the euro either. Therefore, we believe about 80% of the euro's rise on Friday was driven by a bounce off the Senkou Span B line.
From a technical standpoint, on the hourly timeframe, the pair failed to consolidate below the Senkou Span B line, so the upward trend remains intact despite breaking the trend line. If the Kijun-sen line is breached on Monday or Tuesday, the upward movement may continue. Let's recall that we expect only growth for the euro in the medium term, but there will be quite a few important macroeconomic and fundamental events this week, so movements could be varied.
On the 5-minute timeframe, only one trading signal was formed on Friday. During the European trading session, the price bounced off the Senkou Span B line, allowing traders to open long positions. By the end of the day, the pair was rising, and the trade could be closed with a profit of about 30 pips.
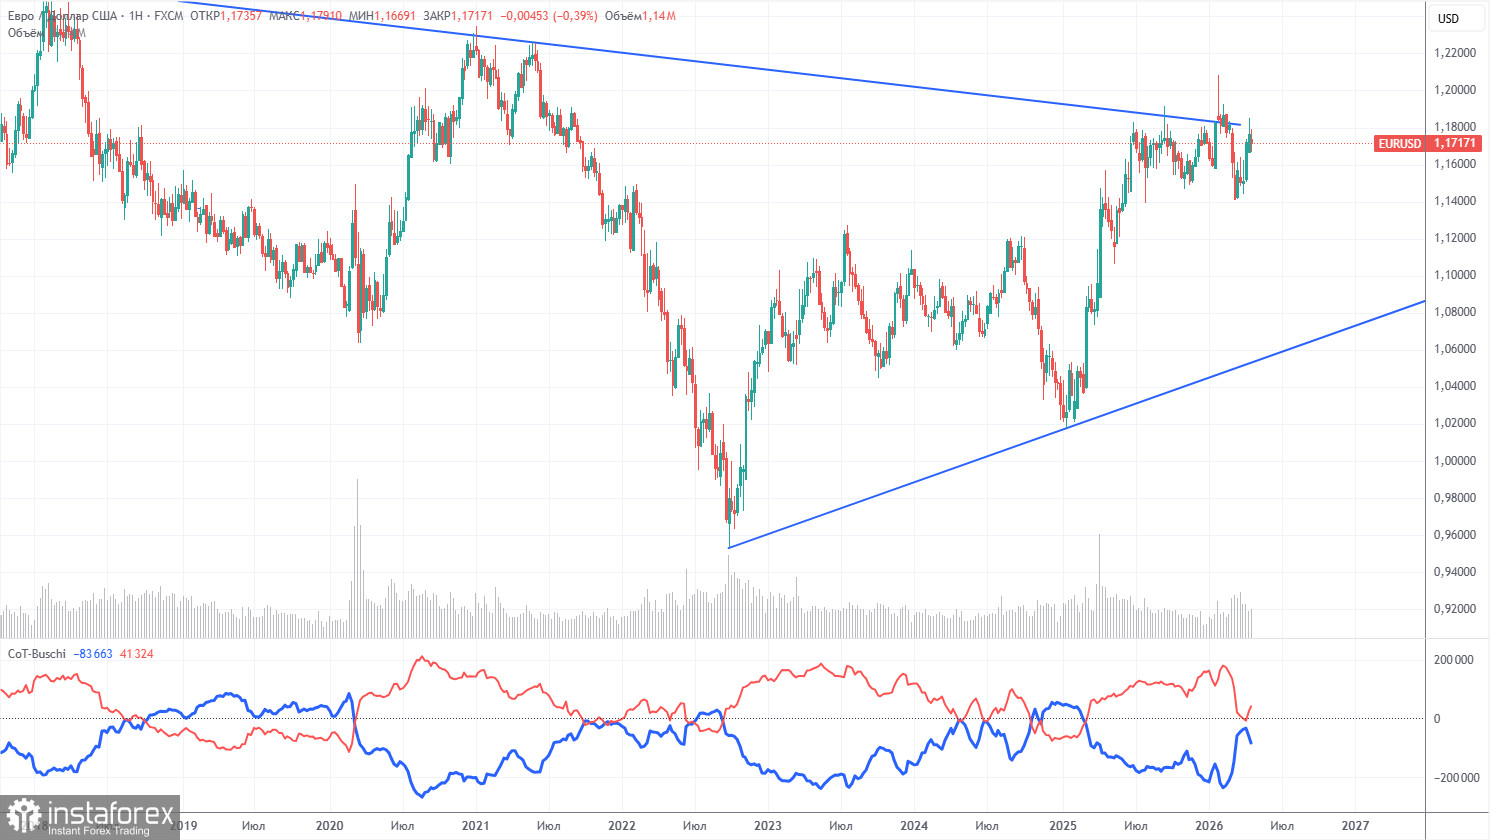
The latest COT report is dated April 21. The illustration of the weekly timeframe clearly shows that the net position of non-commercial traders remains "bullish," but is rapidly decreasing due to geopolitical events. Traders have been shedding the European currency in favor of the U.S. dollar in recent months. Trump's policy remains unchanged, but for some time now, the dollar has served as a "reserve currency." However, this process may already be behind us.
We still do not see any fundamental factors supporting the strengthening of the euro, while there are plenty of factors for the decline of the U.S. dollar. The war in the Middle East has made the dollar temporarily super attractive, but once this factor reaches its "expiration date," everything will revert to the way it was. This expiration may have already occurred. In the long term, the euro could fall as low as 1.06 (the trendline), but the upward trend will still remain relevant. Currently, the pair has not strayed far from the descending trendline, which has been breached several times.
The positioning of the red and blue lines of the indicator indicates parity between bulls and bears. In the last reporting week, the number of longs in the "Non-commercial" group increased by 2,700, while the number of shorts decreased by 12,500. Consequently, the net position increased by 15,200 contracts over the week.
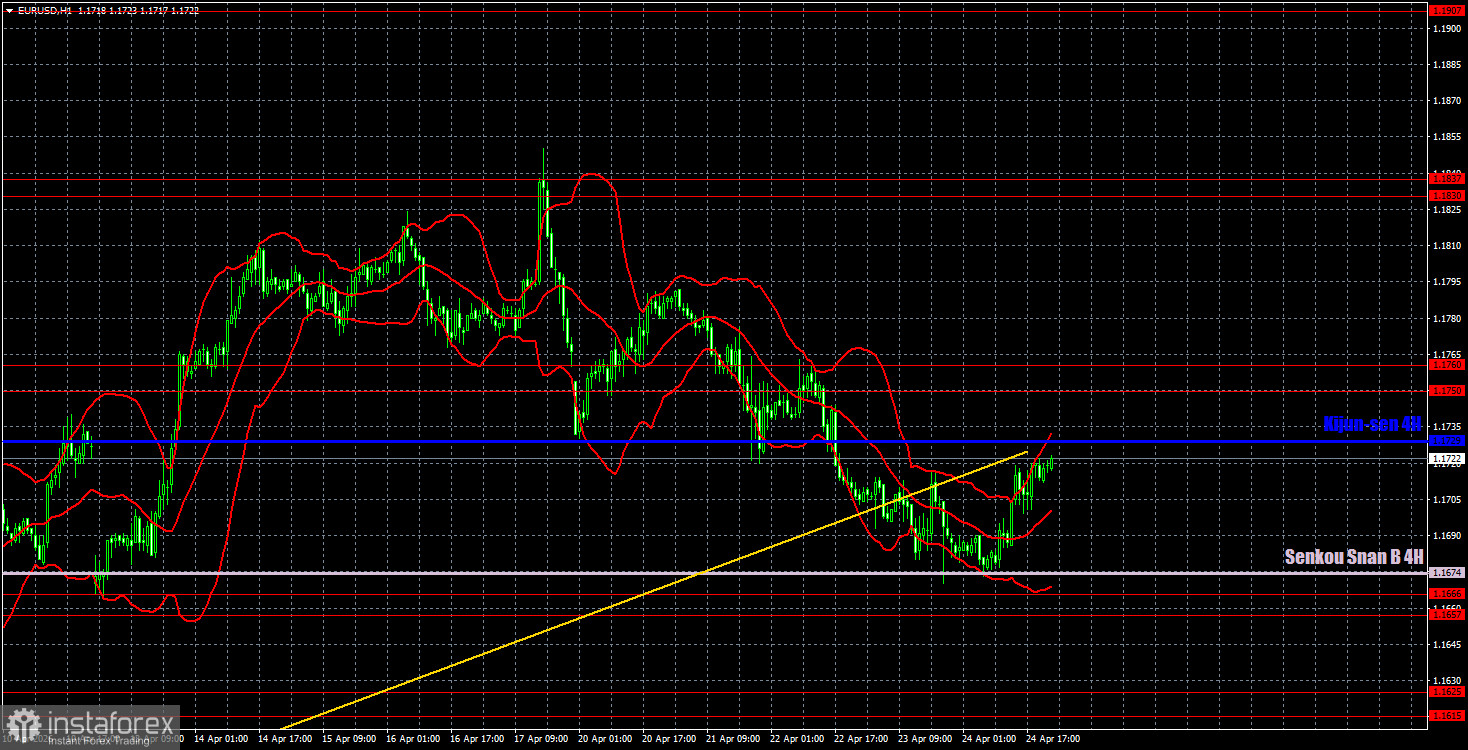
On the hourly timeframe, the EUR/USD pair continues to form an upward trend, but it has only corrected over the past week. The correction may already be complete. The situation in the Middle East remains tense but has not worsened, so there are currently few strong reasons for the U.S. dollar to strengthen. There will be many important events this week, so we can expect the trend to continue and for volatility to remain high.
For April 27, we highlight the following levels for trading: 1.1362, 1.1426, 1.1542, 1.1615-1.1625, 1.1657-1.1666, 1.1750-1.1760, 1.1830-1.1837, 1.1907-1.1922, as well as the Senkou Span B line (1.1674) and the Kijun-sen line (1.1729). The Ichimoku indicator lines may shift during the day, which should be considered when determining trading signals. Don't forget to set a Stop Loss order to breakeven if the price moves 15 pips in the correct direction. This will protect against potential losses if the signal turns out to be false.
On Monday, Germany will publish the consumer confidence index, and that is all the events planned for the day. Therefore, strong movements in the EUR/USD pair are unlikely today.
On Monday, traders may consider opening short positions if the price bounces off the Kijun-sen line, targeting the Senkou Span B line. Long positions can be opened if the price consolidates above the Kijun-sen line, targeting 1.1750-1.1760 and 1.1830-1.1837.
Price levels of support and resistance – thick red lines, around which the movement may end. They are not sources of trading signals.
Kijun-sen and Senkou Span B lines – lines of the Ichimoku indicator that are carried over to the hourly timeframe from the 4-hour one. They are strong lines.
Extreme levels – thin red lines from which the price has previously bounced. They are sources of trading signals.
Yellow lines – trend lines, trend channels, and any other technical patterns.
Indicator 1 on COT charts – the size of the net position of each category of traders.
Đồng USD bước vào tuần giao dịch mới với triển vọng không mấy tích cực. Đà suy giảm của nó đã kéo dà
Nội dung trên đây là về "Trading Recommendations and Analysis for EUR/USD on April 27. A Boring Day, but There Are Profits", được biên tập viên của XM Forex biên soạn và chỉnh sửa cẩn thận. Chúng tôi hy vọng nó sẽ hữu ích cho việc giao dịch của bạn! Cảm ơn sự hỗ trợ của bạn!
Tuyên bố miễn trừ trách nhiệm: Tập đoàn XM chỉ cung cấp dịch vụ thực hiện giao dịch và quyền truy cập vào nền tảng giao dịch trực tuyến của mình, cho phép cá nhân xem và/hoặc sử dụng trang web hoặc nội dung của trang web, nhưng không có ý định thực hiện bất kỳ thay đổi hoặc mở rộng nào, cũng như sẽ không thay đổi hoặc mở rộng các dịch vụ và quyền truy cập của mình. Tất cả việc truy cập và sử dụng sẽ tuân theo các điều khoản và điều kiện sau: (i) Điều khoản và Điều kiện; (ii) Cảnh báo Rủi ro; và (iii) Tuyên bố Miễn trừ Trách nhiệm Hoàn toàn. Xin lưu ý rằng tất cả thông tin được cung cấp trên trang web chỉ mang tính chất thông tin chung. Hơn nữa, nội dung của tất cả các nền tảng giao dịch trực tuyến của XM không cấu thành, và không thể được sử dụng cho, bất kỳ lời mời chào và/hoặc lời mời giao dịch trái phép nào trên thị trường tài chính. Giao dịch trên thị trường tài chính tiềm ẩn rủi ro đáng kể đối với vốn đầu tư của bạn.
Tất cả các tài liệu được công bố bởi các nền tảng giao dịch trực tuyến chỉ nhằm mục đích giáo dục/thông tin và không chứa hoặc nên được coi là lời khuyên và đề xuất về tài chính, đầu tư, thuế hoặc giao dịch, hồ sơ giá giao dịch, hoặc bất kỳ sản phẩm tài chính hoặc ưu đãi liên quan đến tài chính nào được cung cấp thông qua các phương tiện không được yêu cầu.
Tất cả nội dung trên trang web này do XM và các nhà cung cấp bên thứ ba cung cấp, bao gồm ý kiến, tin tức, nghiên cứu, phân tích, giá cả, thông tin khác và liên kết đến các trang web của bên thứ ba, vẫn không thay đổi và được cung cấp như bình luận thị trường chung, không phải lời khuyên đầu tư. Tất cả tài liệu được đăng tải trên các nền tảng giao dịch trực tuyến chỉ dành cho mục đích giáo dục/thông tin và không chứa đựng, cũng không nên được hiểu là, lời khuyên hoặc khuyến nghị liên quan đến tài chính, thuế đầu tư hoặc giao dịch, hoặc như hồ sơ giá cả, hoặc như một lời đề nghị hoặc lời mời giao dịch bất kỳ sản phẩm tài chính nào hoặc các đề nghị tài chính không được yêu cầu. Vui lòng đảm bảo bạn đã đọc và hiểu đầy đủ các mẹo nghiên cứu đầu tư không độc lập và cảnh báo rủi ro của XM. Để biết thêm chi tiết, vui lòng nhấp vào [liên kết/chi tiết]. đây


